FIG 7.
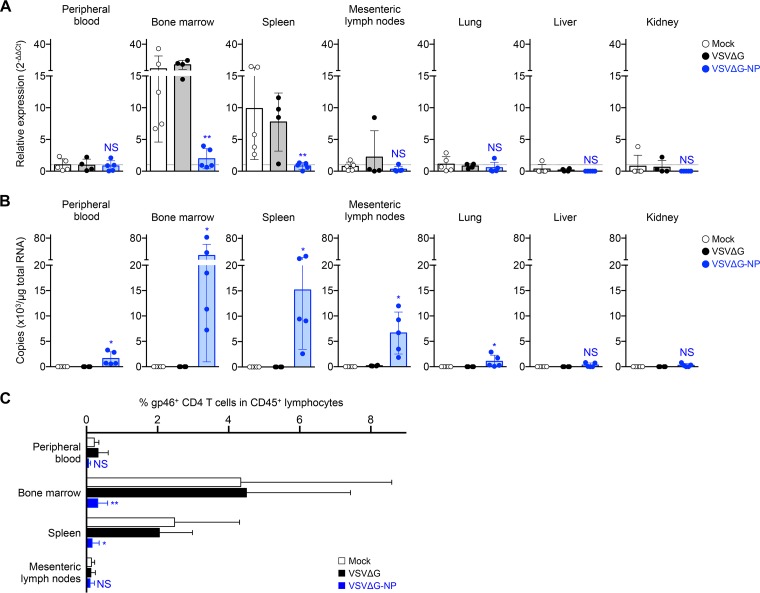
Elimination of HTLV-1 Env-expressing cells in the lymphoid tissues of VSVΔG-NP-inoculated mice. (A) Gene expression profiles of HTLV-1 Env in various organs of coinfected mice. Total RNA was isolated from the peripheral blood, bone marrow, spleen, mesenteric lymph nodes, lung, liver, and kidney of HTLV-1-infected mice following rVSV inoculation at 56 dpi (mock, n = 5, VSVΔG, n = 4, and VSVΔG-NP, n = 5, corresponding with Fig. 6B to E). The expression levels of Env gene were determined by quantitative RT-PCR and were normalized to that of HPRT1. The mean value for the peripheral blood of mock controls is set to 1 as the reference for all specimens. Results are presented as the fold change compared with the reference (dotted line). (B) Quantification of rVSV viral load in various organs of coinfected mice. The total RNA specimens were described above. Real-time RT-PCR was performed to quantify the copy number of VSV-derived viral RNA targeting the L gene. Each dot represents the result from an individual mouse, and the mean ± SD is shown. (C) Cell surface expression of HTLV-1 gp46 was evaluated in the lymphoid tissues of coinfected mice. The bone marrow, spleen, mesenteric lymph nodes, and peripheral blood were harvested from the mice sacrificed at 56 dpi. The frequency of HTLV-1 gp46+ CD4 T cells among human CD45+ lymphocytes in the tissues was analyzed by flow cytometry. The percentages of HTLV-1 gp46+ CD4 T cells in mock-, VSVΔG-, or VSVΔG-NP-inoculated mice are shown. The results are presented as the mean ± SD. Asterisks in panels A and C represent significant differences between mock- versus VSVΔG-NP-inoculated mice (*, P < 0.05, **, P < 0.01, and NS, no statistical significance, by Mann-Whitney U test). Asterisks in panel B represent significant differences between VSVΔG-inoculated and VSVΔG-NP-inoculated mice (*, P < 0.05, and NS, no statistical significance, by Mann-Whitney U test).

