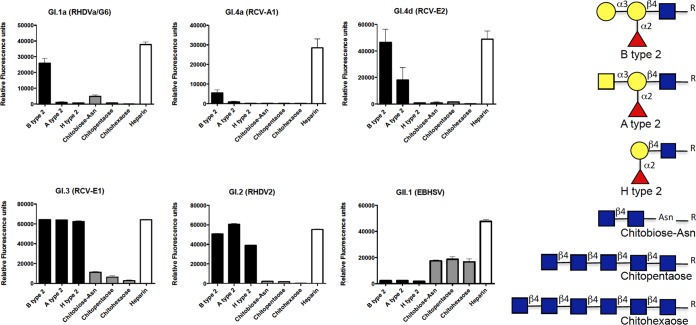
FIG 3.
Results from the printed glycan microarrays. Direct fluorescence measurements were obtained from the printed glycan microarrays incubated with VLPs of each virus strain. Only glycans to which specific binding by at least one of the strains was observed are shown. They are either HBGA-related structures (black bars) or GlcNAc-terminated structures (gray bars). Except for that of heparin (white bars), to which all strains bound most strongly, their structures are shown on the right (blue square, N-acetylglucosamine; yellow circles, galactose; red triangles, fucose; yellow square, N-acetylgalactosamine). The full list of arrayed oligosaccharides (n = 360) is presented in Table S1 in the supplemental material. The results are shown as mean values of six replicates; the error bars represent SD.

