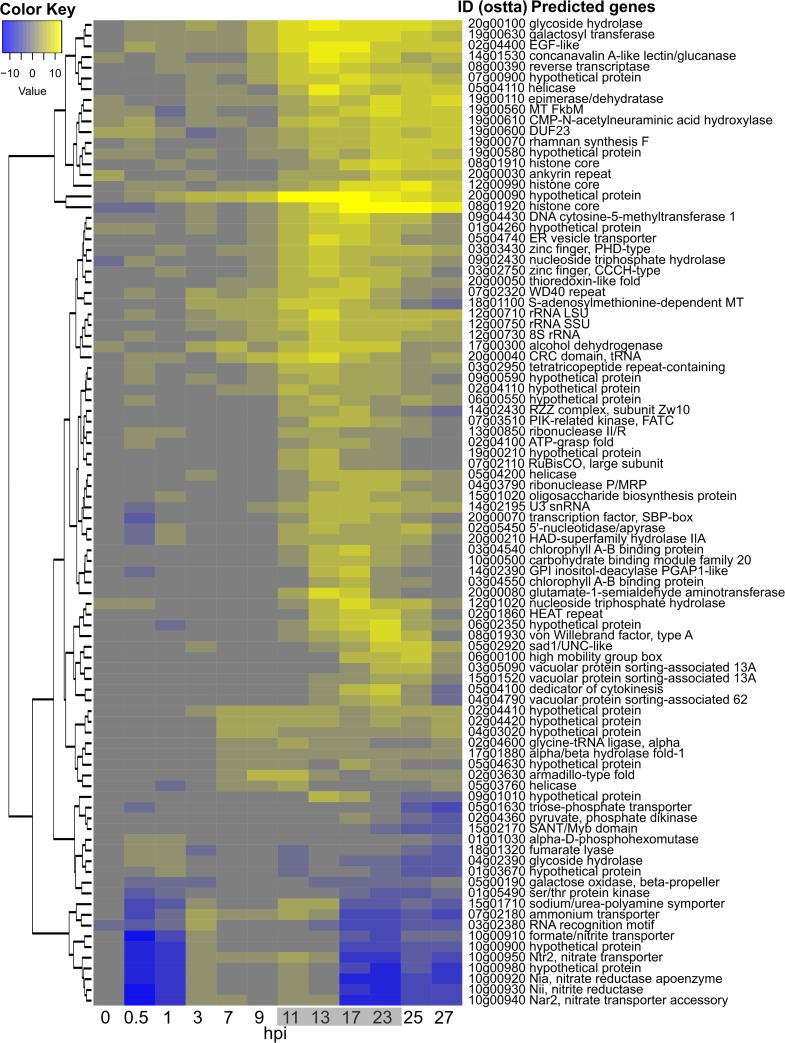
FIG 4.
Differentially transcribed O. tauri genes during a 27-hour infection time course. Time (in hours postinfection) is shown along the abscissa, with time points sampled in the dark shown with a gray background, and rows represent DE genes clustered according to log2-fold changes in expression (a color key is shown in the upper left; see Data Set S2 in the supplemental material for a detailed list of genes).

