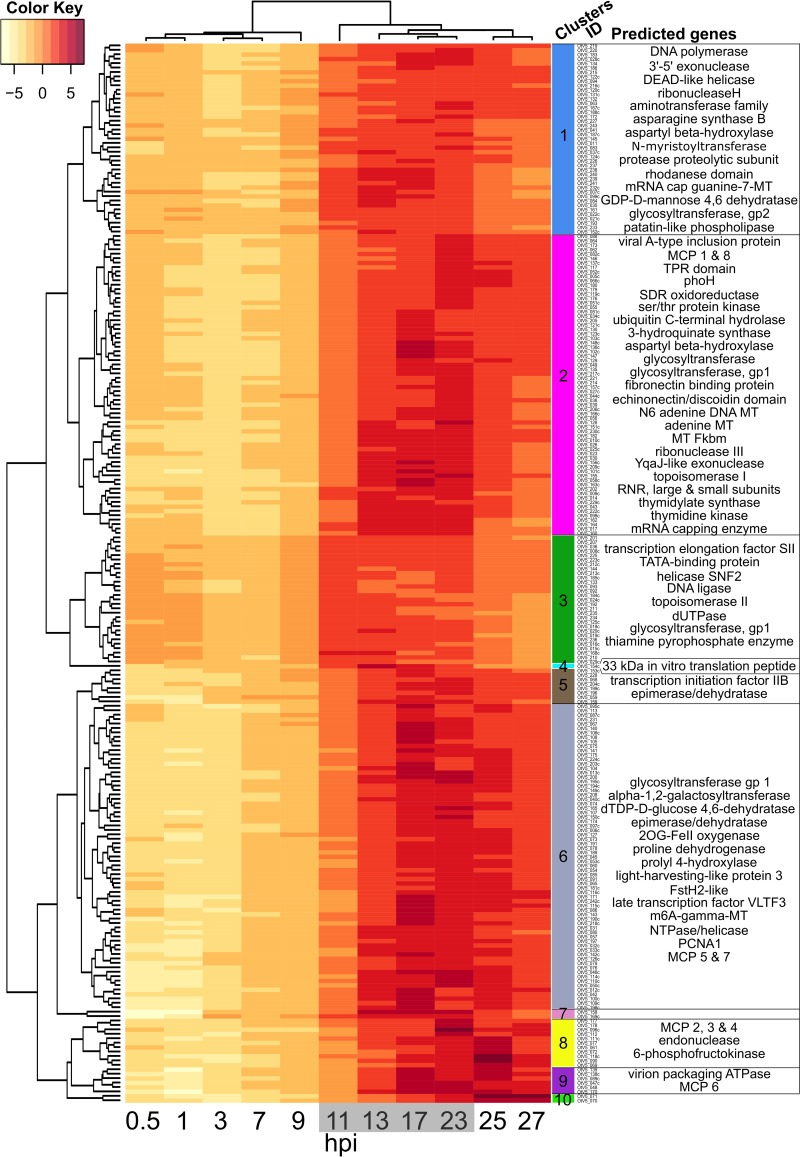
FIG 6.
Timing of OtV5 relative gene transcription during infection. Time (in hours postinfection) is shown along the abscissa, with time points sampled in the dark shown with a gray background. Overall viral gene expression increased strongly after 11 hpi. Rows represent OtV5 genes clustered according to the variation in their relative expression over time (to the left of the dendrogram) and by the relative expression pattern of each sample (above the dendrogram). The “clusters ID” column shows the identity of each gene, providing a link to Data Set S3 in the supplemental material for a detailed list of genes. Only genes with a predicted function (33% of OtV5 coding sequence [CDS], so lines do not correspond with the 247 CDS) are listed in the right-hand column, to provide information about the kinds of functions that appear in that cluster. The color key shows regularized log (rlog)-transformed gene fragment counts centered to the mean of each gene (row means). See Materials and Methods and Data Set S3 for a detailed list of genes.

