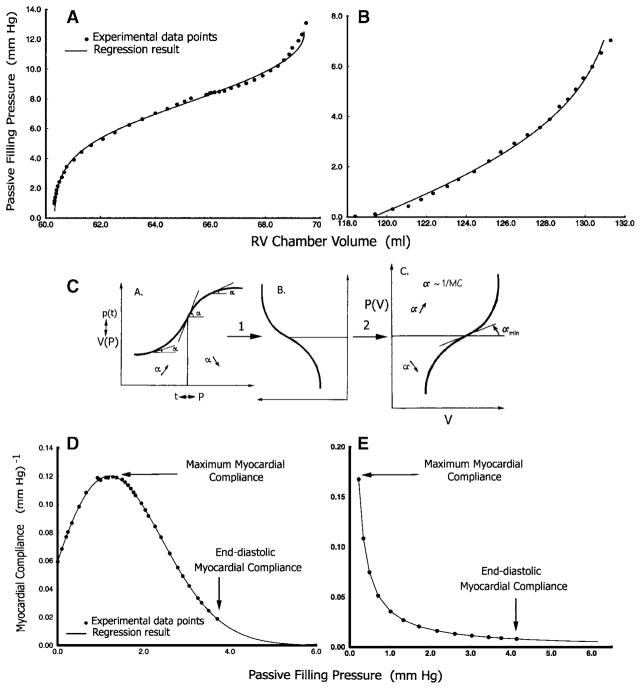
Fig. 4.
Representative shapes of Ppf -V relationships. A: sigmoidal Ppf -V in PO. B: Ppf -V in VO fitted as an exponential; this can also be viewed as the upper portion of a sigmoidal curve. Experimental data points are displayed along with the fitted curves. C: demonstration of how the sigmoidal pressure-volume [P(V)] curve is derived from the logistic curve after substituting pressure (P) for time and volume [V(P)] for population [p(t)] by a 90° counterclockwise rotation and a horizontal 180° flip. D and E: representative myocardial compliance data and curves calculated using curve-fit parameters from a sigmoidal and an exponential Ppf -V relationship, respectively. Approximate maximum and end-diastolic myocardial compliances are labeled.

