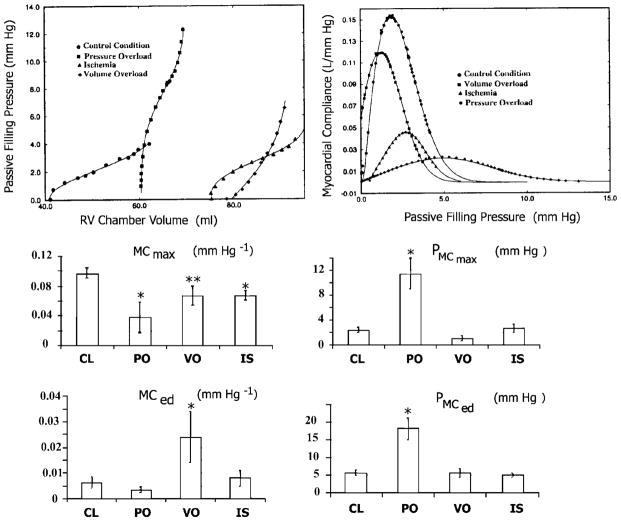
Fig. 7.
Top: representative shapes of RV Ppf -V relationships and corresponding global curves of myocardial compliance at CL, RV pressure overload, volume overload and RV free wall ischemia. Middle: changes in maximum myocardial compliance (MCmax) and the associated filling pressure (PMCmax at the inflection point). Bottom: changes in myocardial compliance (MCed) and the associated pressure (PMCed) at end diastole.

