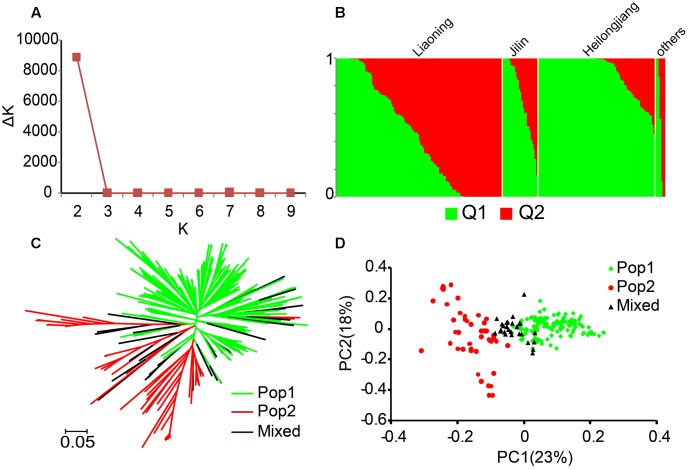
FIGURE 1.
Population structure of 244 rice samples. (A) ΔK values plotted as the number of subpopulations. (B) Subpopulations inferred using Structure. (C) Neighbor-joining tree based on Nei’s genetic distances. (D) Principal component analysis. Values in parentheses indicate the percentage of variance in the data explained by each principal component.

