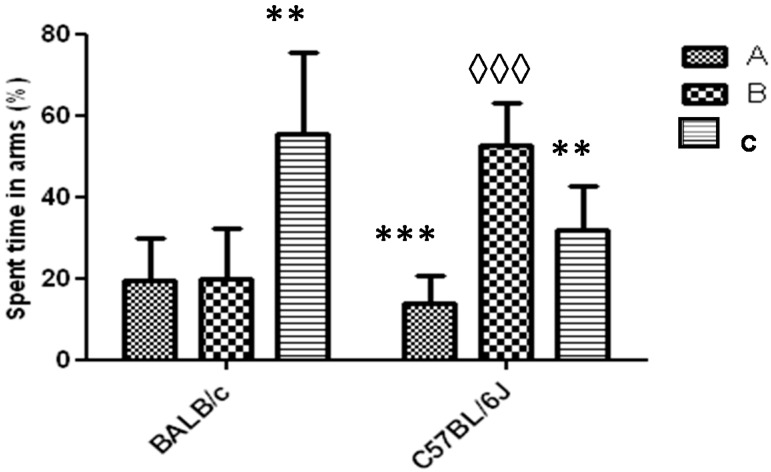
Figure 6.
Response to Y-maze task (one arm blocked) for strains BALB/c and C57BL/6J mice. The letters A, B and C identify each arm during the task (B-arm blocked). Data shows mean ± standard deviations for groups in relation to the spent time in each arm. * Represents significant differences with respect to B arm for each strain. ◊ Represents significant differences between the spent times in the blocked arm (B) between the two strains. A one-way ANOVA was used and the Tukey post hoc test for p < 0.05.

