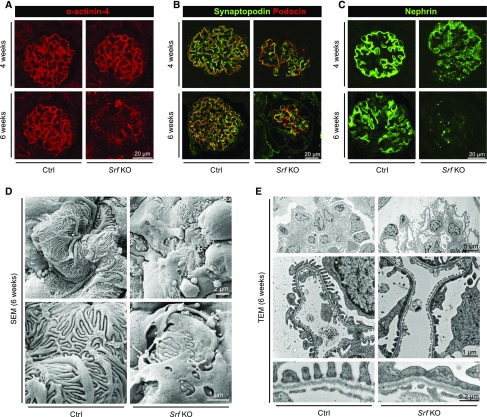
Figure 3.
Podocyte marker expression and ultrastructural abnormalities in Srf KO mice. (A–C) IFM shows diminished and punctate staining of (A) α–Actinin-4, (B) Synaptopodin and Podocin, and (C) Nephrin in mutant mice (n=3) at 4 and 6 weeks of age. (D and E) Representative (D) scanning electron microscopy (SEM) and (E) transmission electron microscopy (TEM) of control and Srf KO kidneys (n=2 each for control and mutant). Note (D, lower panel) foot process effacement and (E, bottom panel) loss of slit diaphragms in Srf KO. Scale bars, 20 μm in A–C; 2 μm in D, upper panel; 5 μm in E, top panel; 1 μm in D, lower panel and E, middle panel; 0.2 μm, E bottom panel.

