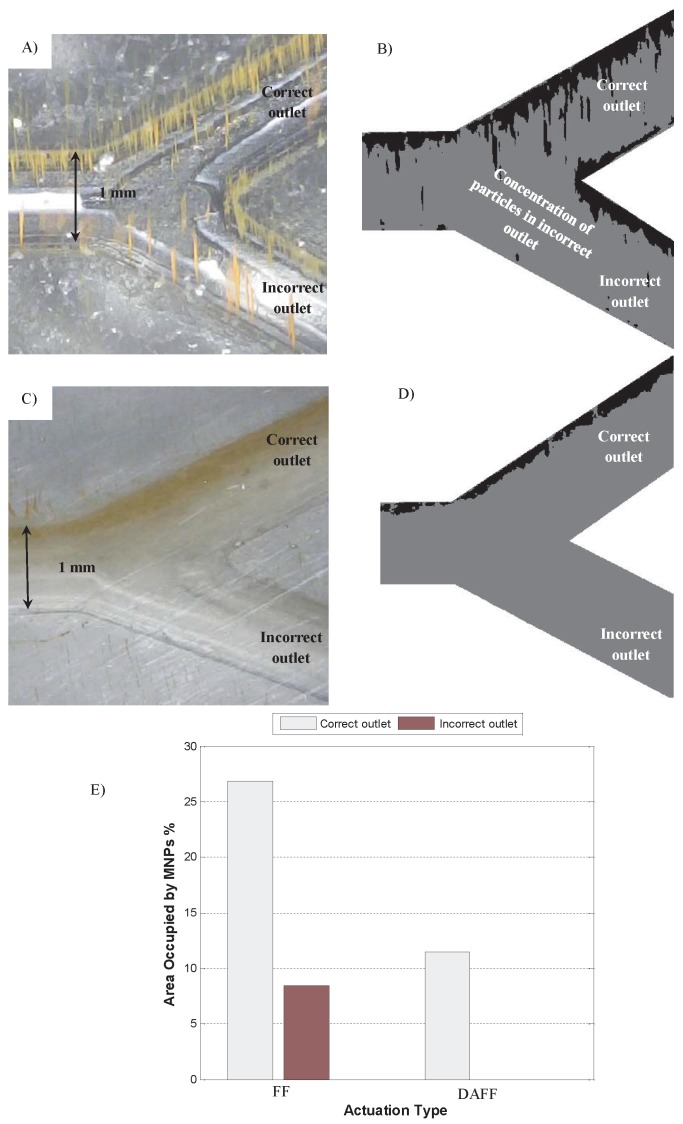
Figure 8.
Video image analysis of the steering performance of a Y-shaped bifurcation. (A) Raw image for a field function (FF) of 6 A and 0.5 Hz. (B) Combined images obtained from averaging several hundred frames (6 A and 0.5 Hz). (C) Raw image under discontinuous asymmetrical field function (DAFF) of 6 A, 0.14 Hz and . (D) Combined images obtained from averaging several hundred frames (6 A, 0.14 Hz and ). (E) The percentage of accumulated nanoparticles (NPs) in the correct and incorrect outlets under FF and DAFF.

