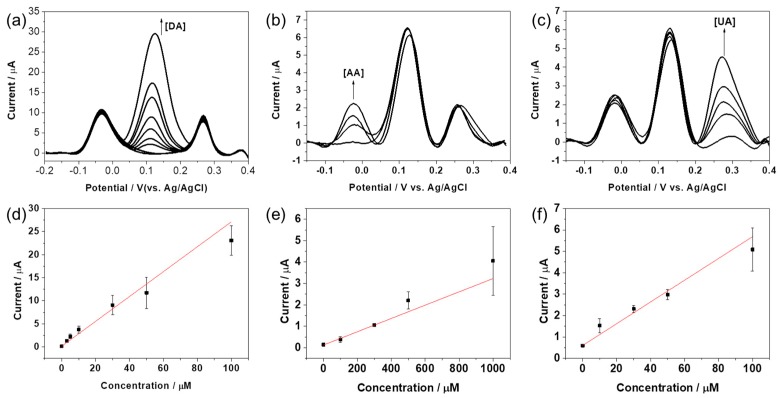
Figure 7.
DPV curves of RGO/AuNPs-GCE in 0.1 M PBS (pH 7.4) mixed solution containing (a) 1 mM AA, 100 μM UA, and DA in different concentrations (0, 1, 3, 5, 10, 30, 50, 100 μM); (b) 100 μM DA, 100 μM UA, and AA in different concentrations (0, 100, 300, 500, 1000 μM); and (c) 1 mM AA, 100 μM DA, and UA in different concentrations (0, 10, 30, 50, 100 μM). Calibration curves of (d) DA, (e) AA, and (f) UA.

