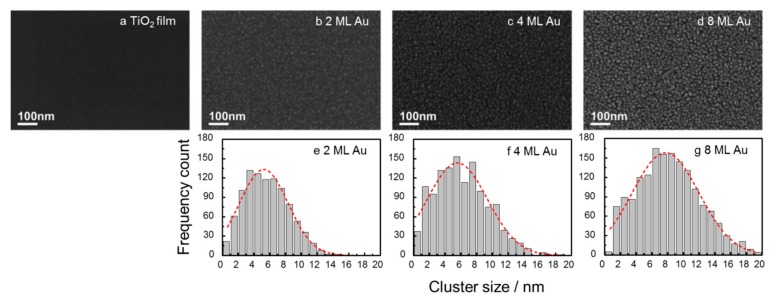
Figure 1.
SEM images of Si wafers supported TiO2 P25 (a). Gas phase Au cluster modified TiO2 P25 films with 2 ML (b), 4 ML (c) and 8 ML (d) equivalent coverage as well as size distribution histograms of 2 ML (e), 4 ML (f) and 8 ML (g) samples. The red dash lines in the histograms are the fittings of cluster distributions.

