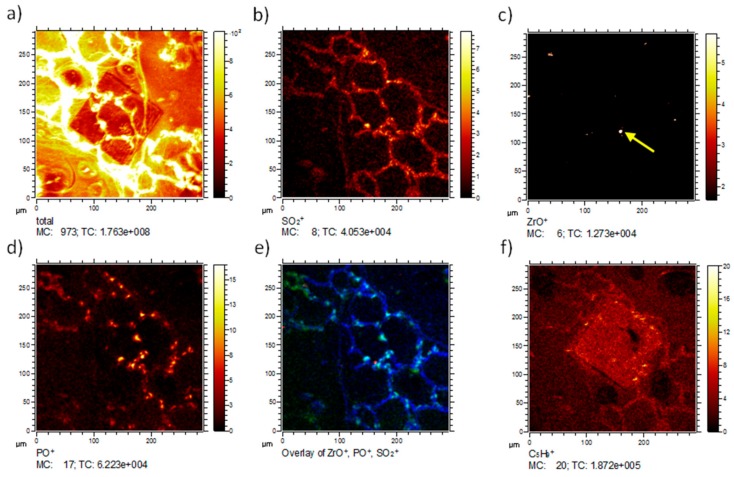
Figure 7.
ToF-SIMS 3D analysis of a ZrO2 NP containing lung section three days post-instillation, previously subjected to IBM measurement (see Figure 5). Lateral distributions of selected secondary ions. (a) The total ion distribution clearly indicates the area of proton bombardment during IBM analysis; (b) The SO2+ distribution resembles the tissue structure; (c) The lateral distribution of 90ZrO+ reveals several intense signals. The central Zr signal (yellow arrow) corresponds to the Zr signal in Figure 5; (d) The PO+ image indicates the presence of phosphorus related compounds, which are typically nuclei and membrane lipids; (e) The red-green-blue (RGB) overlay shows the localization of the ZrO+ (red), PO+ (green) and SO2+ (blue); (f) The C5H9 distribution reveals elevated levels of small organic molecules indicating fragmentation of larger molecules in the area that was treated with the ion beam. (MC: maximum counts per pixel, TC: total counts for the image).

