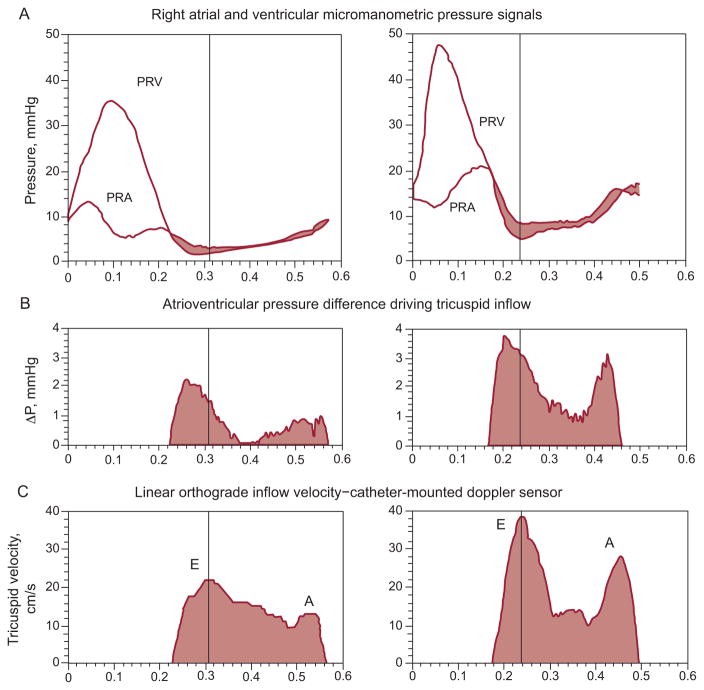
Figure 1.
A: Right-sided transvalvular atrioventricular pressures. B: Atrioventricular transvalvular pressure difference. C: Tricuspid inflow velocity. These measurements were obtained on an experimental dog by multisensor right-heart catheter, approximately 0.5 h (left) after surgically created tricuspid regurgitation and 1 week later (right). Note the pressure levels and the atrial “cannon v-wave.” At peak tricuspid inflow velocity (vertical hairlines), the transvalvular pressure difference, ΔP, has already declined markedly from its peak value. E and A denote the E- and A-waves of diastolic inflow. PRA, right atrial pressure; PRV, right ventricular pressure. Adapted, slightly modified, from Pasipoularides et al.5

