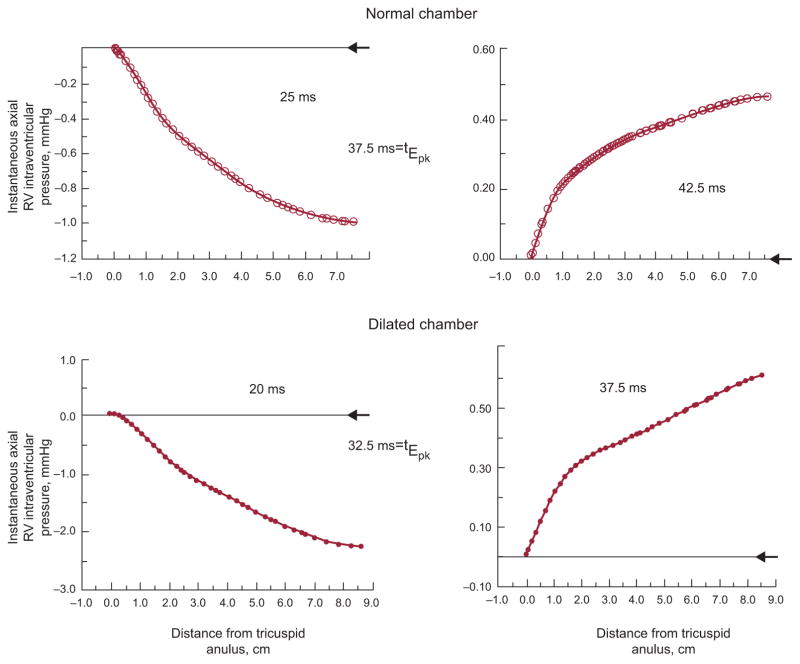
Figure 3.
The axial apportionment of the instantaneous total pressure gradient between tricuspid anulus and apex is shown in a normal and a dilated RV chamber, before (left panels) and shortly after (right panels) the time (tEpk) of the peak of the E-wave. At tEpk, the pressure distribution is transformed from a favorable (pressure decreasing distally) to an adverse (pressure increasing distally) axial pressure gradient. Arrowheads at the right margin of each panel indicate the zero pressure level at the tricuspid anulus. Note the different pressure scales in the individual plots.

