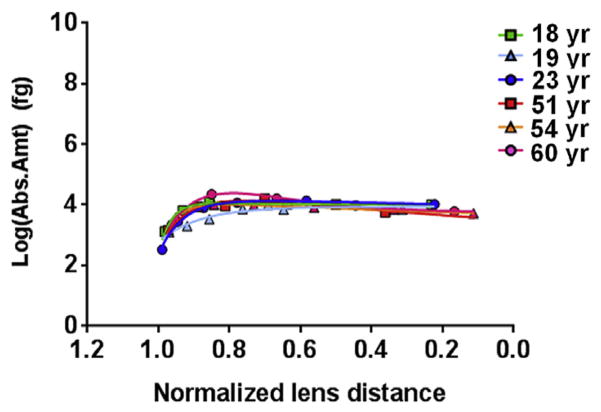
Fig. 4.
Distribution of AQP0 Ser229 phosphorylation in various aged lenses. The average amount of AQP0 pS229 in young and aged lenses is not significantly different. The value graphed here represents the amount of phosphorylated peptide measured per sample. The amount of phosphorylated peptide per picogram of lens membrane protein (as stated in the text) can be determined by dividing this value by 42,183 pg. R2 values for the curves are as follows, 18 yr–0.99, 19 yr–0.93, 23 yr–0.99, 51 yr–0.93, 54 yr–1.00, 60 yr–0.99. Error bars represent standard deviation. See Supplemental Fig. 4c for the 95% confidence bands of the curves.

