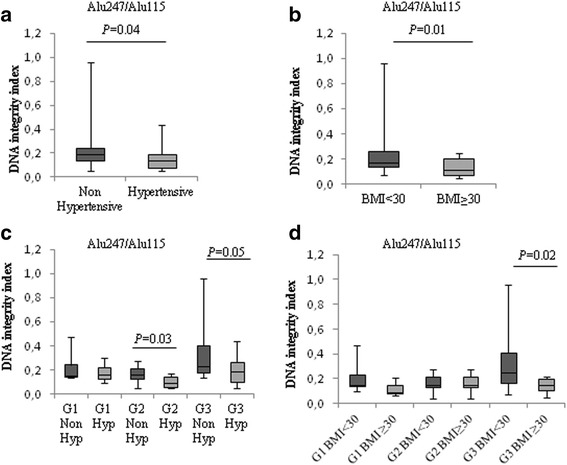
Fig. 1.

CfDNA levels related to hypertension and obesity in EC. Box-plots of DNA integrity index values in non-hypertensive and hypertensive (a), and normal weight (BMI < 30) and obese (BMI ≥ 30) EC patients (b). Cluster analysis of DNA integrity index values from non hypertensive (Non Hyp) and hypertensive (Hyp) (c), or normal weight (BMI < 30) and obese (BMI ≥ 30) (d) in G1, G2 and G3 EC samples. The upper border of the box indicates the upper quartile (75th percentile) while the lower border indicates the lower quartile (25th percentile), and the horizontal line in the box the median. P values, Mann–Whitney U test
