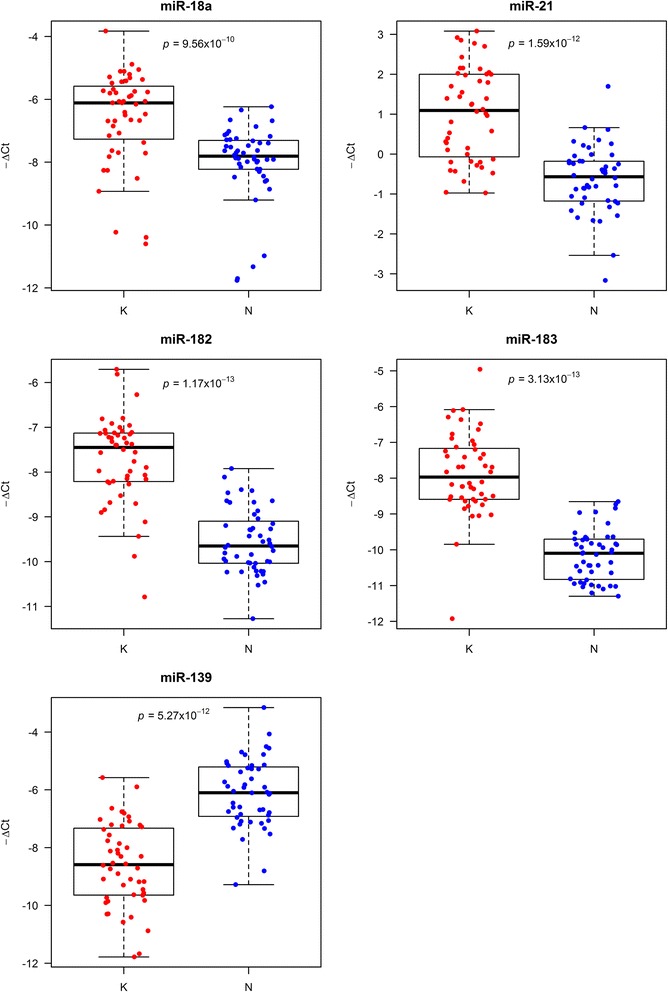
Fig. 1.

Boxplots of the distribution of –ΔCt values in tumor tissue versus matched normal mucosa for miR-18a, miR-21, miR-182, miR-183 and miR-139. Each dot represents a patient sample. –ΔCt values were calculated using miR-200c as a reference. Differences between cancer tissue (K) and matched normal mucosa (N) samples were analyzed using one-tailed Wilcoxon rank-sum test
