
Fig. 3.
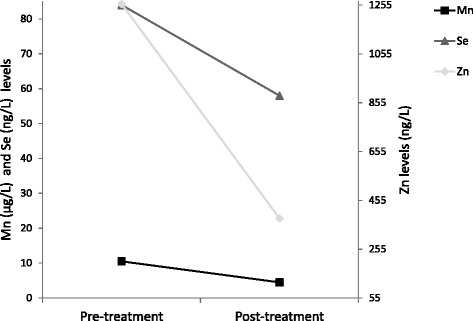
Biochemical analysis before and after treatment. Footnote: Graph shows a reduction of plasma Mn, Zn and Se five days after Na2CaEDTA therapy
Official websites use .gov
A
.gov website belongs to an official
government organization in the United States.
Secure .gov websites use HTTPS
A lock (
) or https:// means you've safely
connected to the .gov website. Share sensitive
information only on official, secure websites.
Biochemical analysis before and after treatment. Footnote: Graph shows a reduction of plasma Mn, Zn and Se five days after Na2CaEDTA therapy