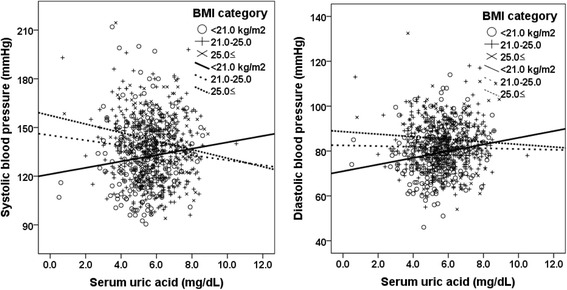
Fig. 2.

Correlation between serum uric acid and blood pressure status of participants categorized by body mass index. In body mass index (BMI) < 21.0 kg/m2, serum uric acid correlated positively with both systolic blood pressure (SBP) and diastolic blood pressure (DBP) (r = 0.112, p = 0.100 and r = 0.163, p = 0.016, respectively), but in BMI ≥21.0 kg/m2 serum uric acid correlated negatively with both SBP and DBP (BMI 21-25 kg/m2, r = − 0.108, p = 0.024 and r = − 0.022, p = 0.651; BMI ≥25.0 kg/m2, r = − 0.178, p = 0.023 and r = − 0.064, p = 0.421, respectively). Analysis of covariance showed that three regression lines in each graph were significantly different (SBP, F = 8.139, P = 0.004 and DBP, F = 5.199, P = 0.023, respectively)
