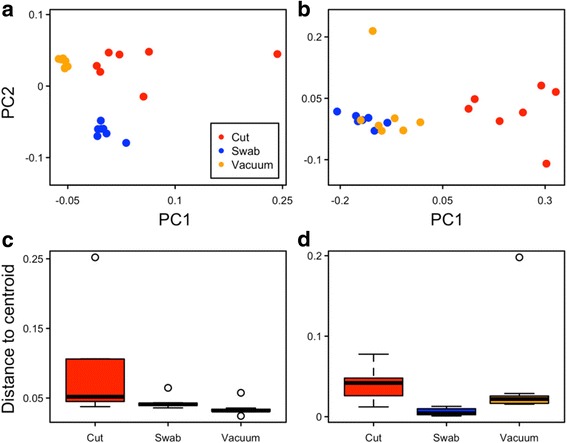
Fig. 5.

Community repeatability by sample type. PCoA plots for (a) bacteria (variance explained PC1 = 44% and PC2 = 22%) and (b) fungi (variance explained PC1 = 59% and PC2 = 9%) are based on weighted UniFrac and Morisita-Horn distances, respectively. Boxplots for (c) bacteria and (d) fungi represent distances to group centroids produced by the betadisper function in Vegan, which runs an analysis of multivariate homogeneity of dispersions
