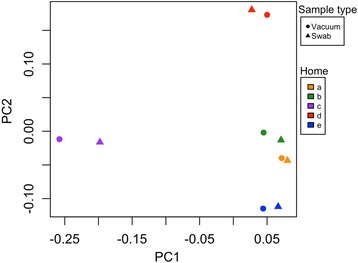
Fig. 6.

Bacterial community clustering by household and sample type (PCoA). Color denotes household. The orange points (house “a” in the legend) are from the house filter analyzed throughout this paper. Shape denotes sample type (circle = vacuum, triangle = swab). Cut samples and fungal sequences were not available for the multi-home analysis
