Fig. 2.

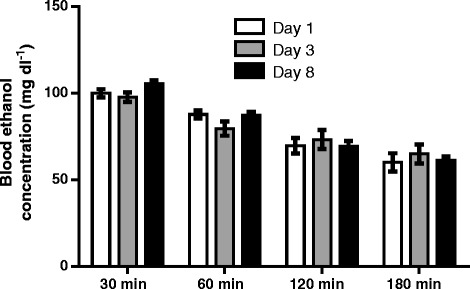
Bar graphic shows changes in blood ethanol concentrations at different times after administration of ethanol at day 1, 3, and 8 treatments. Ethanol (3.2 g/kg) was administered once every day for 8 consecutive days (n = 4)

Bar graphic shows changes in blood ethanol concentrations at different times after administration of ethanol at day 1, 3, and 8 treatments. Ethanol (3.2 g/kg) was administered once every day for 8 consecutive days (n = 4)