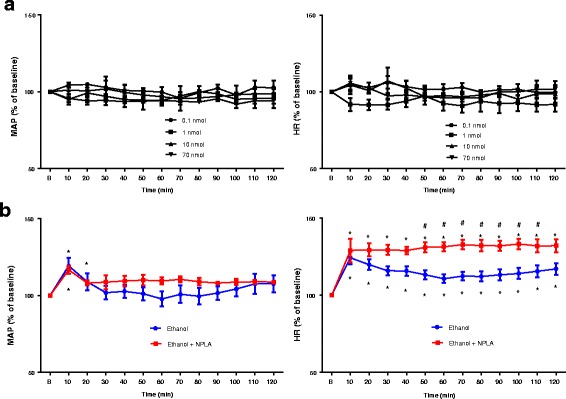
Fig. 5.

a Line graph shows the time course of percentage changes in MAP (left) and HR (right) after ICV injection of different doses of NPLA, a nNOS inhibitor (n = 4 each). The average BP and HR 60 min before NPLA injection are taken as baseline (b) of 100%. b Line graph show time course of percentage change in MAP (left) and HR (right) after administration of ethanol (3.2 g/kg) with or without ICV treatment with 10 nmol NPLA (n = 4) on day 1 treatment of ethanol. NPLA was given immediately after ethanol administration. The average BP and HR 60 min before ethanol administration are taken as baseline (b) of 100%. *P < 0.05 compared with baseline (b) using repeated measure one-way ANOVA followed by Dunnett’s post-test. #P < 0.05 compared with ethanol group analyzed by repeated measure two-way ANOVA followed by Bonferroni post-test
