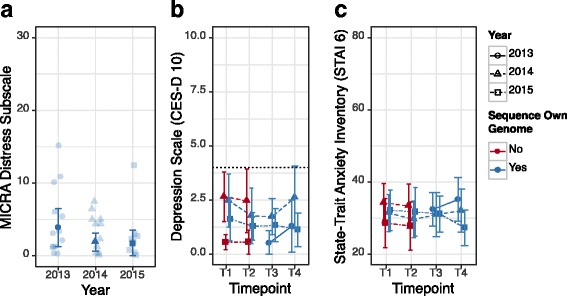
Fig. 3.

Test-related distress and psychological wellbeing by time point and year. Mean and 95% confidence interval for: a test-related distress (MICRA Distress subscale) post-course (T4), b depression (CES-D 10 Dichotomous), and c anxiety (STAI 6) across time point and course year. Individual scores on the MICRA Distress Subscale are shown in reduced opacity. For context, panels b and c also include reported depression and anxiety at T1 and T2 of students who did not sequence their own genome (either by choice or because they were ineligible). Since so few students at T3 and T4 could not or did not sequence their own genome, their data is not shown. The dotted line in panel b shows the cutoff for clinically significant depressive symptoms on the CES-D 10 Dichotomous (≥ 4) [48]
