Fig. 1.

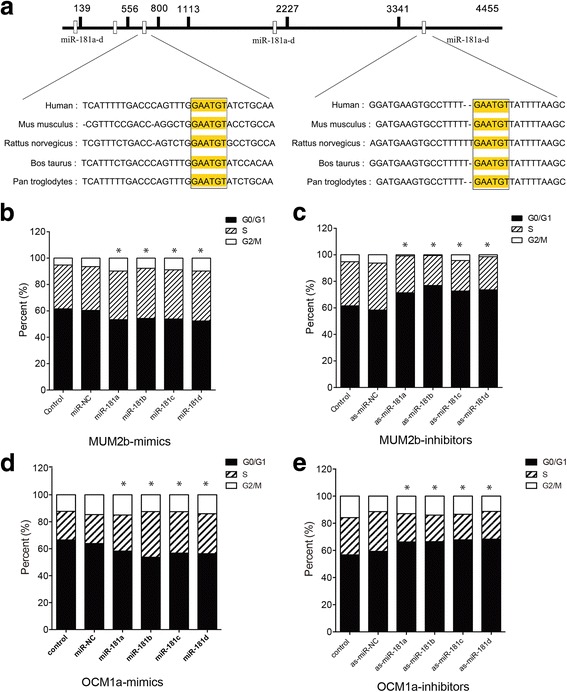
The conservation and cell cycle analysis of miR-181 family members. a Schematic of the miR-181 family putative target sites in the human 3’-UTR of CTDSPL. The sequences of the miR-181 family members are partly evolutionarily conserved in Homo sapiens, Mus musculus, Rattus norvegicus, Bos taurus and Pan troglodytes. Yellow indicates the conserved sequence. The hollow white rectangle indicates the five different gene loci of the miR-181 family members. b and (c) The cell cycle distribution was detected. The fraction of cells in G0/G1-phase was significantly decreased by 8-12%, and the periods of S-phases were significantly increased 6-15% after the mimics of miR-181 family members were transfected into MUM2b cells compared with the control and miR-NC groups (P < 0.05). In contrast, the fraction of cells in G0/G1 phase was significantly increased by 15-18%, and the period of S-phases was significantly decreased 15-20% after the inhibitors of miR-181 family members were transfected into MUM2b cells. d and (e) The fraction of cells in G0/G1-phase was significantly decreased by 10-20%, and the periods of S-phases were significantly increased 8-18% after the mimics of miR-181 family members were transfected into OCM1a cells compared with the control and miR-NC groups (P < 0.05). In contrast, the fraction of cells in G0/G1 phase was significantly increased by 12-15%, and the period of S-phases was significantly decreased 8-12% after the inhibitors of miR-181 family members were transfected into OCM1a cells
