Fig. 2.

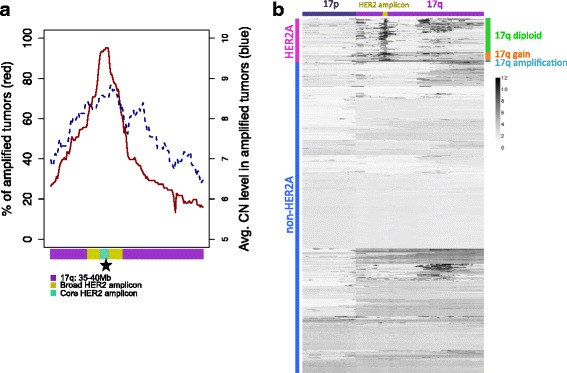
Characterization of the human epidermal growth factor receptor 2 (HER2) amplicon and HER2 co-amplification in breast cancer. a Percentage of 106 HER2 amplified (HER2A) tumors from The Cancer Genome Atlas (TCGA) with gene amplification (solid red line, left axis), and average copy number (CN) level in HER2A tumors with gene amplification (indicated in dashed blue line, right axis), for genes on chromosome 17 from 35 Mb to 40 Mb (ordered by genomic location). Shown at the bottom are core HER2 amplicon (10) and broad HER2 amplicon (37) genes. The HER2 locus is starred. b Copy number of genes on chromosome 17 is shown for HER2A (top) and non-HER2A (bottom) TCGA tumors. Three distinct groups of HER2A tumors are labeled on the right: tumors with 17q arm-level amplification, defined as 5 or more copies for at least 80% of genes (cyan); tumors with 17q gain (copy number between 2.5 and 5 for 80% or more genes) (orange); and tumors that are mainly 17q diploid with copy number <2.5 for the majority of 17q genes (green). Chromosome 17 annotation is indicated on top. Regions 34.4–34.6 Mb and 44.1–44.8 Mb with germline micro-deletions or micro-gains were removed for visual purposes (see Additional file 9F-G)
