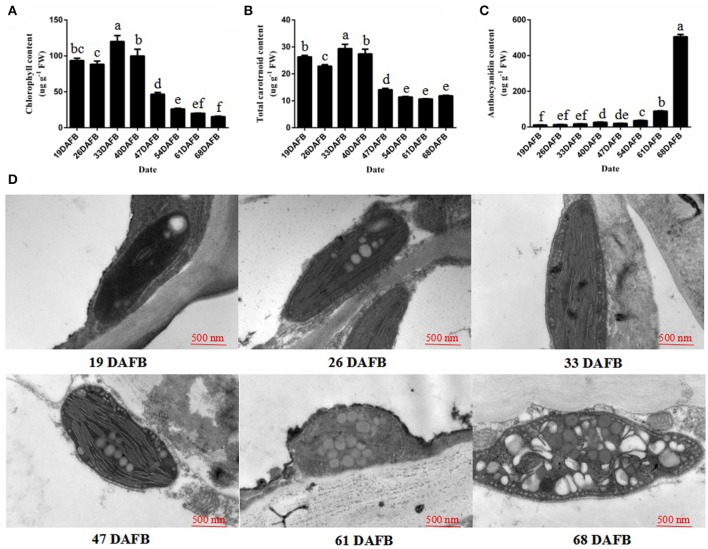
Figure 1.
Chlorophyll, the total carotrnoid, anthocyanin contents, and chloroplast development during fruit ripening. (A) Chlorophyll content in peach skin during fruit development. (B) Total carotenoid content in peach skin during fruit development. (C) Anthocyanin content in peach skin during fruit development. (D) Transmission electron micrographs of chloroplast development in peach skin during fruit ripening. Data is presented as the means ± SD, n = 3. Different letters above bars denote statistical significance according to one-way ANOVA and Duncan's test (P < 0.05).

