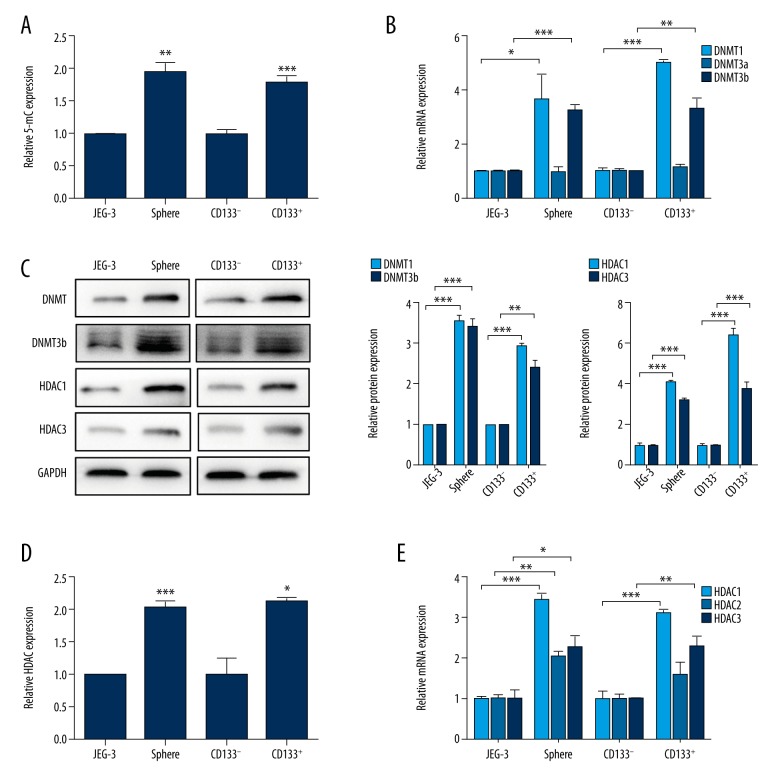
Figure 1.
Higher DNMT and HDAC expression in choriocarcinoma CSLCs. (A) Quantification of 5-mC in non-CSLCs versus CSLCs (JEG-3 vs. sphere and CD133− vs. CD133+). Data are shown as relative expression compared with non-CSLCs (JEG-3 and CD133−). (B) RT-PCR analysis of DNMTs mRNA levels in non-CSLCs vs. CSLCs. (C) Western blot analysis of DNMT1, DNMT3b, HDAC1, and HDAC3 protein levels in non-CSLCs vs. CSLCs. GAPDH was used as the internal control (left). Respective relative changes in DNMTs (middle) and HDACs (right) protein levels. (D) Total HDAC activity of non-CSLCs vs. CSLCs. (E) RT-PCR analysis of HDACs mRNA levels in non-CSLCs vs. CSLCs. Data represent mean ±SD from at least 3 independent experiments, * p<0.05; ** p<0.01; *** p<0.001.

