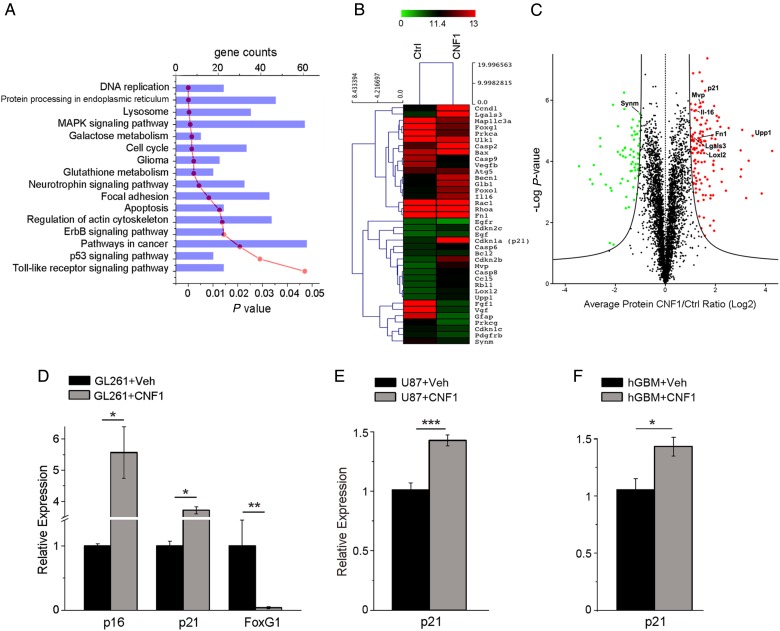
Fig. 1.
Transcriptomic and proteomic profile of CNF1-treated glioma cells. Genes and proteins differentially expressed in CNF1- vs vehicle-treated glioma cells, 48 h after treatment. (A) The most significant gene categories are displayed at the top of the graph downward (P-value, red line) and gene numbers are arranged horizontally by the length of the bars (gene counts, blue bars). (B) Microarray heat map of selected genes differentially expressed at 48 h in CNF1-treated GL261 cells. Gene expression is represented by the intensity of colors (green: lowest expression; red: higher expression). Note significant upregulation of senescence-associated genes such as p21 and Upp1, and downregulation of several growth factor receptors (EGF and PDGF receptors) in CNF1-treated samples. (C) Volcano plot of all quantified proteins (4246 total). The triplicate average ratio CNF1 vs control was plotted against their t-test statistical log P-values. Significantly regulated proteins (total of 196 proteins, permutation corrected false discovery rate < 0.001) were colored in red and green for up- and downregulation, respectively. (D) Quantitative RT-PCRs showing the relative expressions of the senescence markers p21 (Cdkn1a, cyclin-dependent kinase inhibitor 1) and p16 (Cdkn2a, cyclin-dependent kinase inhibitor 2), and the negative p21 regulator FoxG1 (Forkhead box protein G1) in GL261 cells. (E, F) Increased expression of p21 in human glioma cells: U87 cell line (E) and patient-derived GBM cell cultures (F). Data are mean ± SEM. *P < .05, **P < .01, ***P < .001 (t-test).

