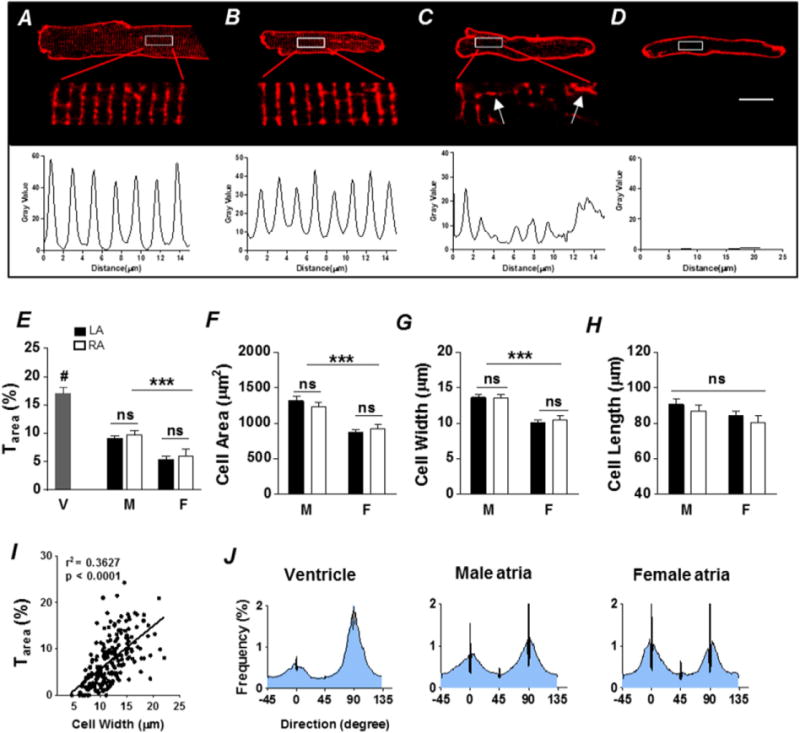
Fig. 1.

Heterogeneity of TATs in mouse atria. Di-4-ANEPPS membrane staining showing an organized TAT network in a representative ventricular myocyte (A) and three representative atrial myocytes with either well-organized TATs (B), disorganized TATs (C), or no TATs (D). Scale bar = 10 μm. Corresponding fluorescence intensity plots (shown below the images) of the enlarged TAT area show a spacing of ≈1.8 μm in ventricular myocytes (A) and organized atrial myocytes (B), while the pattern in a disorganized atrial myocyte (C) is less regular. Arrows in panel C indicate obvious axial tubules in atrial myocytes. E, summary plot of TAT density (Tarea,%) in left atria (LA, black) and right atria (RA, white) from male (M) and female (F). Ventricular (V) cells are included for comparison. ***P < 0.001, M vs. F; #P < 0.01, V vs. A, one-way ANOVA. Summary plots of cell area (F), width (G) and length (H) of left and right atrial myocytes from M vs. F. ***P < 0.001, one-way ANOVA. I, dependence of Tarea on cell width. n = 63 (M LA), 38 (M RA), 62 (F LA) and 30 (F RA) cells from 8 animals, and n = 12 cells from 3 animals for ventricle (V). Average frequency distributions of TAT orientation (J) in ventricular myocytes (left), male atrial myocytes (middle) and female atrial myocytes (right), indicate that atrial myocytes generally have a higher proportion of axial tubules (0° ± 20°) compared with ventricular myocytes. Nevertheless, male atrial cells possess prominent transverse (90° ± 20°) elements.
