Fig. 2.

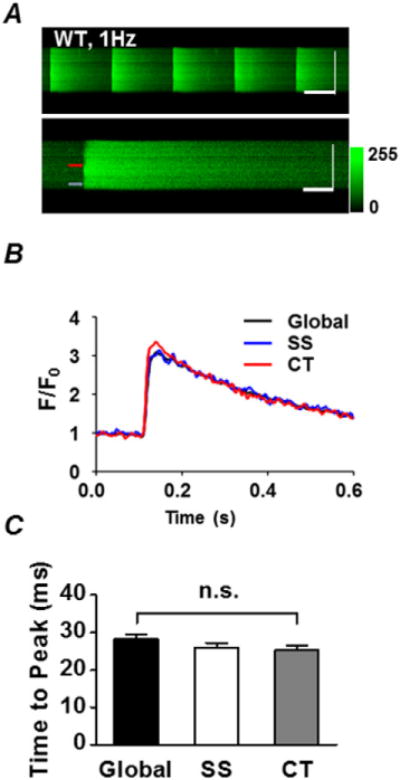
Synchronous Ca release in atrial myocytes. A, confocal line-scan images of five Ca transients (CaT) from a representative atrial myocyte loaded with Fluo-4-AM and field stimulated at 1 Hz (upper image), and a single CaT taken from the same cell but shown on an expanded time scale (lower image). Horizontal scale bars represent 500 ms (upper panel) and 100 ms (lower panel), while vertical scale bars represent 10 μm for both images. B, fluo-4 fluorescence intensity (F/F0) plots over time from the cell in A, at 1.5 μm from the subsarcolemmal space (SS, blue) or in the cell center (CT, red). Colour-coded arrows on the upper image correspond to the locations where the fluorescence was sampled for panel B. The global CaT is shown in black. Note the typical synchronous Ca release and uptake at both locations (with the global trace overlapping the SS and CT traces). C, summary plot of the time to peak (TTP) of the global, SS and CT CaT. P > 0.05, one way ANOVA with Bonferroni’s Multiple Comparison post-test, n = 61 cells from N = 6 animals. Note that there are no significant differences in TTP among the groups indicating simultaneous release.
