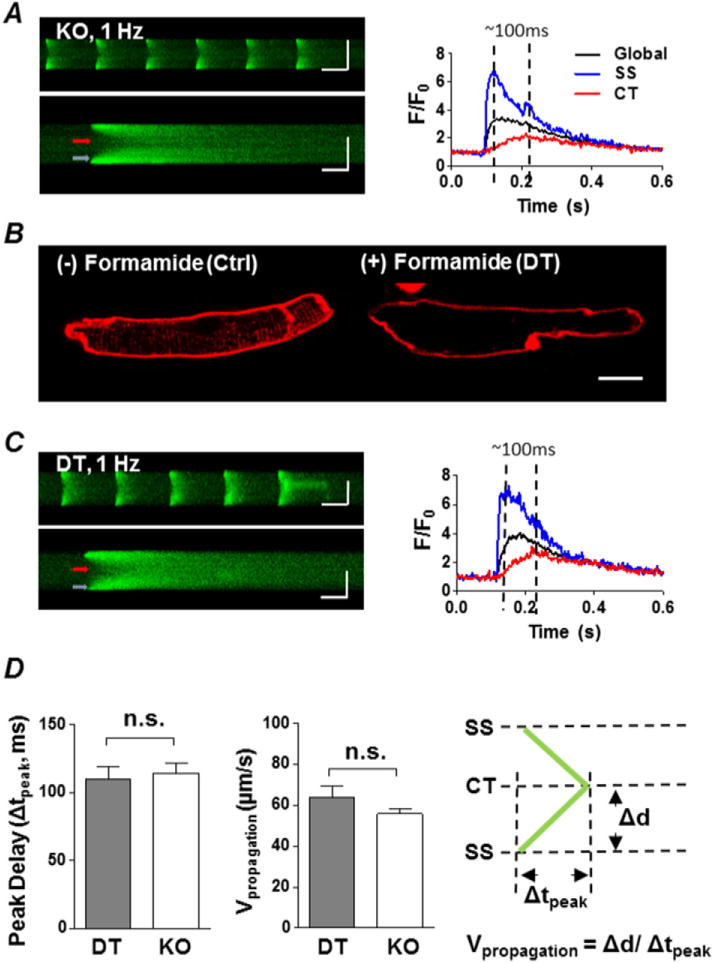
Fig. 5.

KO atrial myocytes have a similar centripetal propagation process as detubulated (DT) atrial myocytes. A, left, representative transverse confocal line-scan image of a series of electrically stimulated CaTs (upper panel) and a single transversal CaT recording (lower panel) of a KO atrial myocyte. Colour coded arrows indicate locations used to plot SS (blue) and CT (red) fluorescence intensity over time (right panel). Global CaT is shown in black. Horizontal scale bars represent 500 ms (upper panel) and 100 ms (lower panel), while vertical scale bars represent 10 μm for both images. B, Di-4-ANEPPS staining shows one normal atrial myocyte before formamide incubation (Ctrl, left) and one detubulated cell after formamide incubation (DT, right). Scale bar = 10 μm. C, similar to A but in a DT myocyte. D, summary plot of mean time difference (Δtpeak) between the peak of CT CaTs and the peak of SS CaTs during pacing, and the centripetal propagating velocity (Vpropagtion) in DT vs. KO. Vpropagtion was calculated as propagating distance divided by peak delay (right panel). P > 0.05, DT (n = 9 cells from 3 animals) vs. KO (n = 27 cells from 6 animals), unpaired Student’s t-test.
