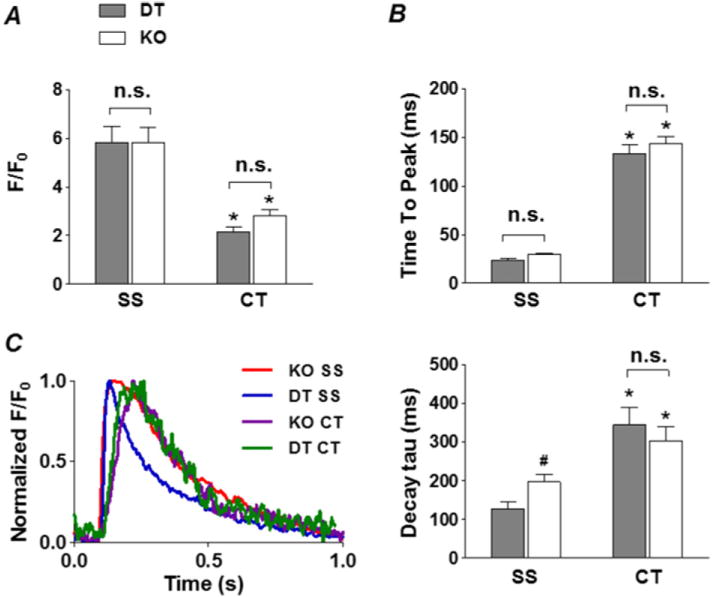
Fig. 6.

Effect of NCX KO on Ca uptake. Summary plots of the amplitude (F/F0, A), time to peak (B) and local CaTs from SS and CT regions in DT (grey) and KO (white) atrial myocytes. C, left, shows normalized, field stimulation-induced intracellular CaTs from representative DT and NCX KO myocytes at the SS regions (DT, blue; NCX KO, red), as well as the CT regions (DT, green; NCX KO, purple); right, summary plot of the local CaT decay tau from SS and CT regions in DT (grey) and KO (white) atrial myocytes. *P < 0.05, CT vs. SS, #P < 0.05, KO vs. DT, unpaired Student’s t-test, n = 9 cells from 3 animals for DT, n = 27 cells from 6 animals for KO. Note the slowed decay in the SS region of NCX KO compared to DT.
