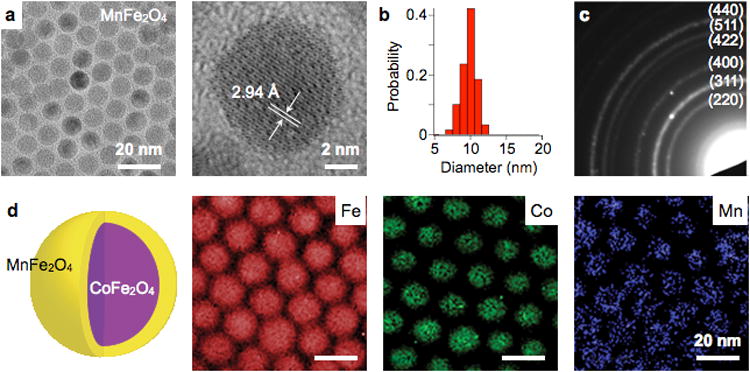
Figure 13. MNP analysis by TEM.

(a) TEM imaging allows for fast assessment of particle shape (magnetic core), down to the atomic length scale. A crystal lattice plane of a ferrite MNP is shown. (b) Size distribution of particles in (a) were obtained. (c) In the diffraction mode, TEM can be used to display the reciprocal lattice pattern. Shown here is the electron diffraction pattern of MnFe2O4 MNPs. Concentric ring patterns corresponding to the spinel structure are identified. (d) By scanning the electron beam and performing spectroscopic measurements, the composition of particles can be mapped. The element of CoFe2O4 (core) / MnFe2O4 (shell) MNPs were imaged using the electron energy loss spectroscopy (EELS) method. Reproduced with permission from Ref. 44. Copyright 2009 National Academy of Sciences, USA. Reproduced with permission from Ref. 217. Copyright 2011 Nature Publishing Group.
