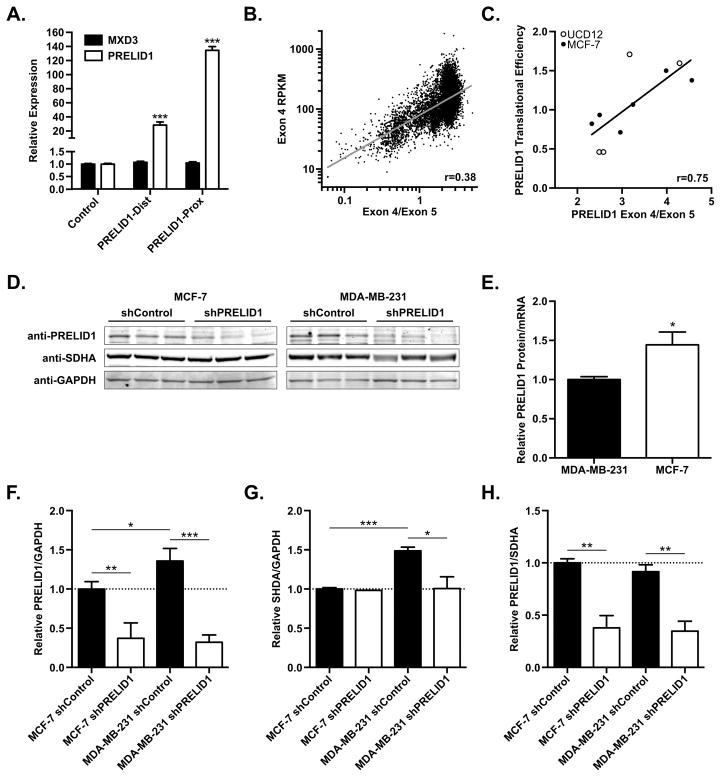
Figure 2. PRELID1 APA correlates with transcript abundance and translational efficiency.
A. Relative expression of PRELID1 (white) or the adjacent MXD3 (black) measured by RT-qPCR following overexpression of PRELID1-Dist/Prox in MCF-7. Expression is relative to transfection with pCMV-Empty (“Control”). RT-qPCRs were performed in duplicate on two separate biological replicates, and an unpaired t-test was used to assess significance. B. PRELID1 Exon 4 expression (y-axis) vs. PRELID1 Exon 4/Exon 5 ratio (APA; x-axis) for all tumors in TCGA. n=10033; Pearson coefficient (r) from least-squares fit. C. PRELID1 ORF translational efficiency (y-axis) vs. PRELID1 Exon 4/Exon 5 ratio (APA; x-axis) for MCF-7 (filled circles) and UCD-12 (empty circles). n=10; Pearson coefficient (r) from linear regression. D. Representative Western blot showing PRELID1, SHDA and GAPDH in MCF-7 and MDA-MB-231 whole cell lysates. Western blot was performed twice on separate biological replicates. An unpaired t-test was used to assess significance of western blot densitometry. E. PRELID1 protein expression (western blot) relative to PRELID1 mRNA (measured by RT-qPCR) in MCF-7 and MDA-MB-231 clonal cell lines, normalized to MDA-MB-231. F. Quantitation of PRELID1 relative to GAPDH in (D). G. Quantitation of SDHA relative to GAPDH in (D). H. Quantitation of PRELID1 relative to SDHA in (D). A Two-way ANOVA (cell line x shRNA) followed by Tukey’s post hoc test was used to determine significance. *p<0.05, ***p<0.001

