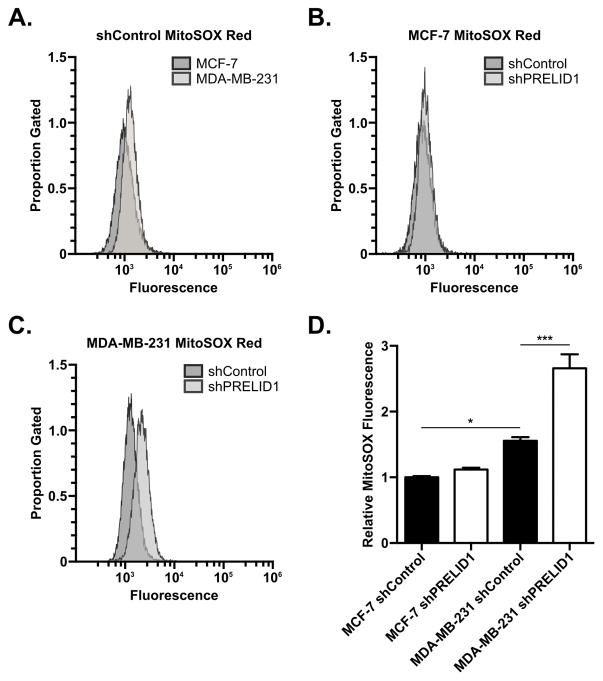
Figure 4. PRELID1 knockdown increases mitochondrial ROS production in ER− breast cancer cells.
A. MitoSOX Red fluorescence (x-axis) vs. proportion of gated events (y-axis) for MCF-7 shRNA control (dark grey) vs. MDA-MB-231 shRNA control (light grey; representative clones). B. MitoSOX Red fluorescence (x-axis) vs. proportion of gated events (y-axis) for MCF-7 shRNA control (dark grey) vs. MCF-7 PRELID1 shRNA knockdown (light grey; representative clones). C. MitoSOX Red fluorescence (x-axis) vs. proportion of gated events (y-axis) for MDA-MB-231 shRNA control (dark grey) vs. MDA-MB-231 PRELID1 shRNA knockdown (light grey; representative clones). D. Relative MitoSOX fluorescence (per-clone median) by shRNA group. Flow was performed on three separate clonal cell lines per group on two separate occasions. Histograms are from representative runs. A Two-way ANOVA (cell line x shRNA) followed by Tukey’s post hoc test was used to determine significance. *p<0.05, **p<0.01, ***p<0.001

