
Figure 7.
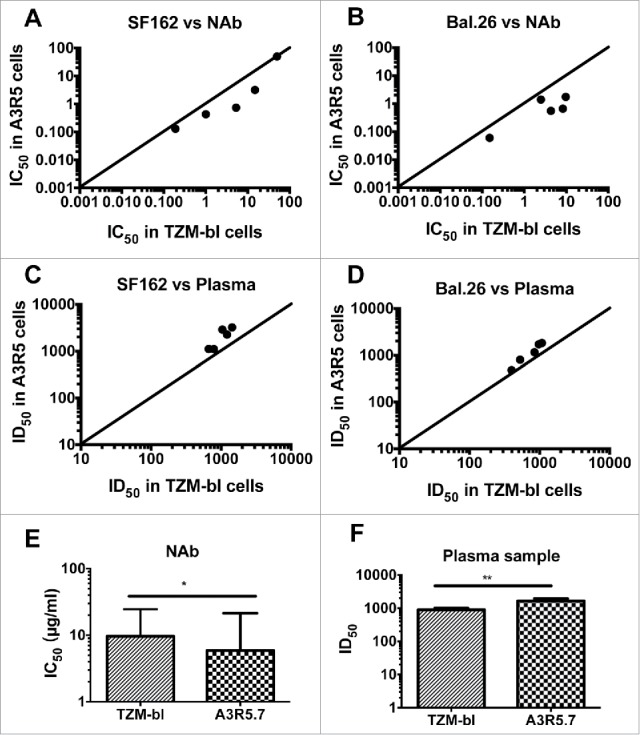
Comparison of the pseudovirus A3R5 assay with the TZM-bl assay tested against tier 1 pseudoviruses. Five NAbs (2F5, 4E10, PG16, 2G12 and b12) were tested against two pseudoviruses SF162 (A) and Bal.26 (B). Five plasma samples (HB4, HB118, HB120, BJ182 and TJ208) were tested against the same two pseudoviruses SF162 (C) and Bal.26 (D). The diagonal line depicts x = y (TZM-bl ID50/IC50 = A3R5 ID50/IC50 values). Statistical analyses for NAb (E) and plasma (F) samples were conducted respectively (Wilcoxon matched pairs test, * for p<0.05, and ** for p < 0.01).