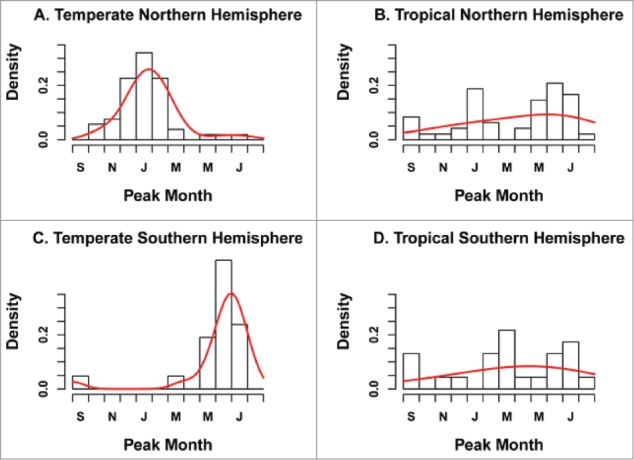
Figure 1.

Distribution of RSV peak month by geographic zone (n = 96 locations). The black histogram represents observations while the red curve illustrates the fit of a Gaussian density kernel. Reproduced from: Bloom-Feshbach K, Alonso WJ, Charu V, Tamerius J, Simonsen L, Miller MA, Viboud C. Latitudinal Variations in Seasonal Activity of Influenza and Respiratory Syncytial Virus (RSV): A Global Comparative Review. PLOS ONE 2013;8:e54445.
