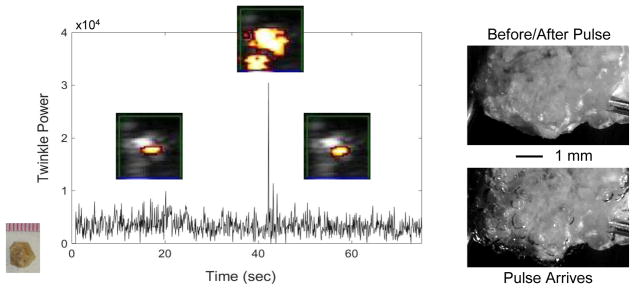
Figure 3.
Plot of twinkle power versus time before, during, and after a pre-focal, off axis lithotripter pulse arrives at a COM stone. Overlaid on the plot are selected ROI Doppler images (image scale: 1-cm width) showing the stone (grey) and twinkling (color) on the stone. When the lithotripter pulse arrives at about 45 sec, bubbles are excited on the stone surface, as observed with high-magnification, high-speed photography (right), and twinkle power increases transiently (for one Doppler imaging frame) by more than six times. After the lithotripter pulse and cessation of bubble oscillation, twinkling returns to approximately initial levels. These data were collected with the P4-2 transducer.

