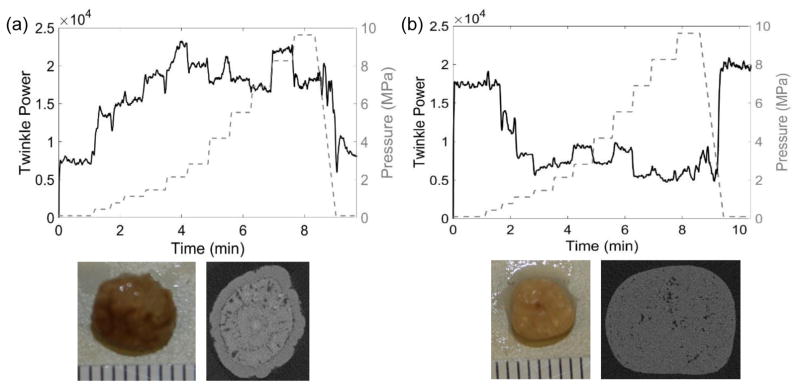
Figure 9.
Plots of twinkle power versus time and absolute static pressure (MPa; right y-axis) for (a) a calcium oxalate dihydrate (COD) stone and (b) a cystine stone. (a) The μCT cross section of this COD stone shows a slightly rough stone surface with a ringed structure and some internal micro-crevices comprising 8.6% of the center slice area. The twinkle power was initially of moderate amplitude and generally increased with pressure. (b) The μCT cross section of this cystine stone shows a macroscopically smooth surface with a scattering of micro-crevices throughout the stone comprising 3.7% of the center slice void. Twinkling was initially quite strong and decreased with elevated pressure and then stayed at a constant, non-zero level. In both cases, twinkling returned to its initial amplitude when pressure was returned to ambient levels. These data were collected with the P4-2 transducer.

