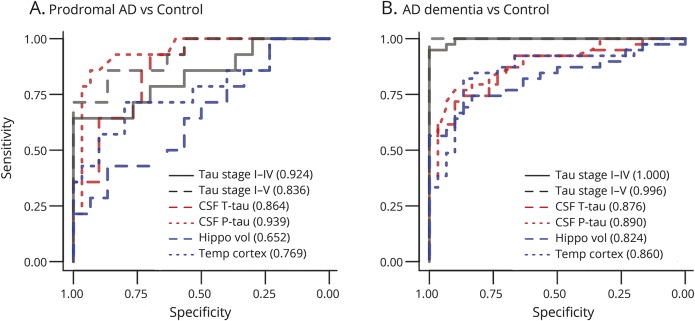
Figure 3. Area under the receiver operating characteristic curve (AUROC) analyses.
AUROC analyses for the 18F-AV-1451 signal from the tau stage region I–IV, tau stage region I–V, CSF total tau (t-tau) and phosphorylated tau (p-tau), hippocampal volume, and temporal lobe cortical thickness, to differentiate prodromal Alzheimer disease (AD) (A) and AD dementia (B) from controls. AUROCs are shown in the legends. AUROCs for hippocampal volume were adjusted for intracranial volume. For prodromal AD vs controls, tau stage I–IV, CSF t-tau, and CSF p-tau had higher AUROCs than hippocampal volume (p = 0.0055; p = 0.024; p = 0.0065). For AD dementia vs controls, tau stage I–V and tau stage I–IV PET had higher AUROCs than CSF t-tau (p = 0.0033; p = 0.0025), CSF p-tau (p = 0.0040; p = 0.0038), hippocampal volume (p < 0.001; p < 0.001), and temporal lobe cortical thickness (p = 0.0034; p = 0.0038).

