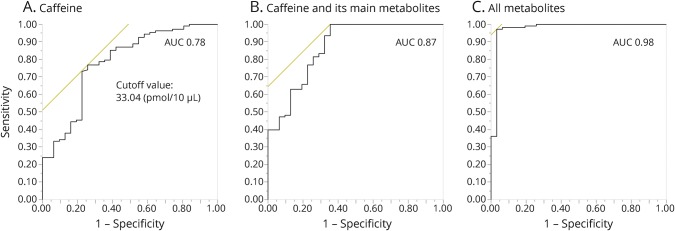
Figure 1. Receiver operating characteristic (ROC) curves.
ROC curves were made by the Youden index using the maximum of sensitivity + specificity − 1 ([A] caffeine, [B] caffeine and its main metabolites, [C] all metabolites). The optimal cutoff point was calculated using the maximum sensitivity + specificity. The main metabolites were paraxanthine, theophylline, and theobromine. AUC = area under the curve.

