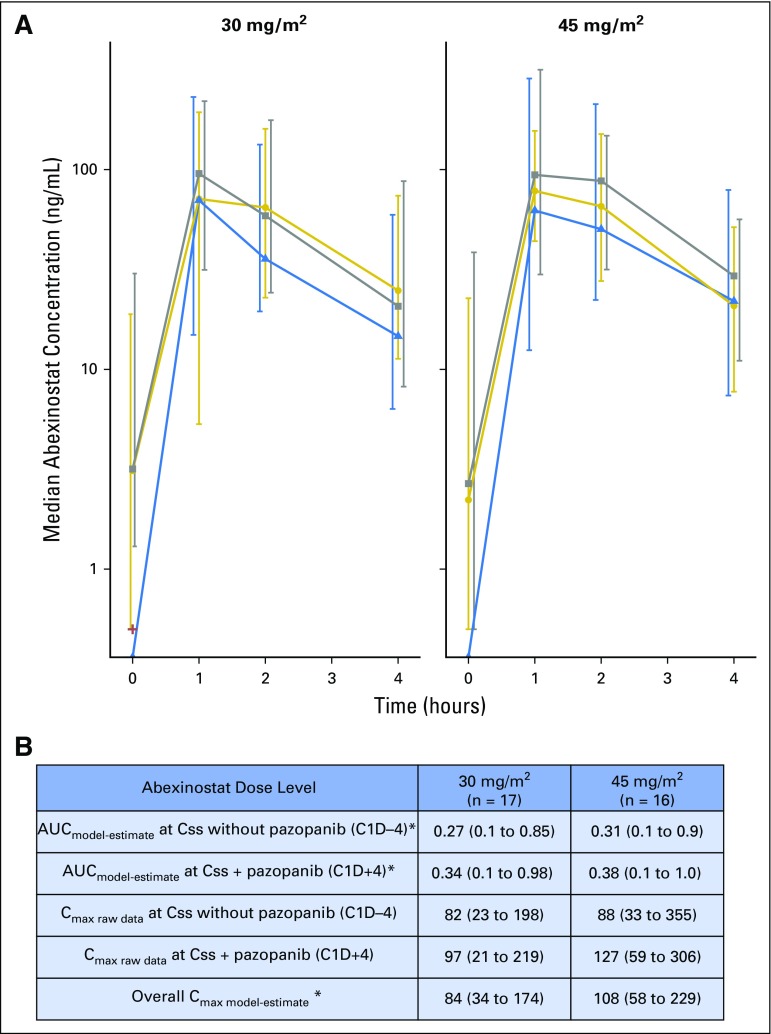
Fig 3.
Summary of abexinostat pharmacokinetics. (A) Raw plasma concentrations of abexinostat by dose level. Median and interquartile range of observed concentrations presented by occasion and dose level is shown. Abexinostat concentrations at first dose without pazopanib (C1D-7, blue triangles, dotted blue line); at steady state concentration (Css) without pazopanib (C1D-4, gold circles, gold line); at Css with pazopanib (C1D + 4 gray squares, dashed gray line). (B) Estimated pharmacokinetic parameters of abexinostat. Median area under the concentration-time curve (AUC; ng*h/L) and median maximum serum concentration (Cmax; ng/mL) and 95% CIs are presented. (*)Individual pharmacokinetic parameters AUC and Cmax were estimated by using the population pharmacokinetic parameters of abexinostat as previously described.11 Cmax, maximum serum concentration.

