Fig 4.
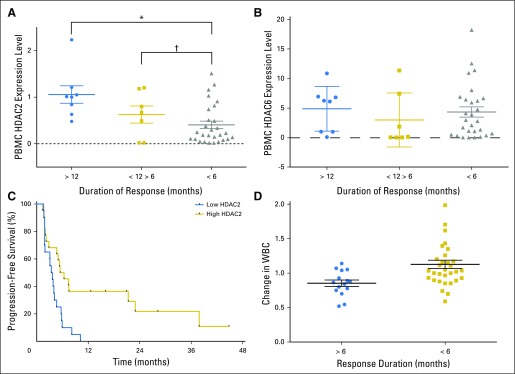
Biomarkers predictive of response to therapy. (A) Peripheral blood mononuclear cell (PBMC) histone deacetylase 2 (HDAC2) expression levels by subgroups of patients categorized by duration of response. Kruskal-Wallis test for comparison across three groups: P = .0025. Mean (± standard error of the mean [SEM]) values are as follows: > 12 months, 1.1 (± 0.19); 6 to 12 months, 0.63 (± 0.18); and < 6 months, 0.41 (± 0.08). (*)Mann-Whitney test to compare > 12 months versus < 6 months: P = .0019. (†)Mann-Whitney test to compare 6 to 12 month versus < 6 months: P = .0129. (B) PBMC HDAC6 expression levels and duration of response. Kruskal-Wallis test for three-way comparison, P = .39. Mann-Whitney test for pairwise comparisons: < 6 months v > 6 to < 12 months, P = .23; < 6 months and > 12 months, P = .59. (C) Progression-free survival according to HDAC2 expression in PBMCs. Kaplan-Meier curve for patients (n = 43) according to HDAC2 expression in PBMCs: low HDAC2 expression (< 0.4; 3.5 months) versus high HDAC2 expression (> 0.4; 5.9 months); hazard ratio (95% CI) by log rank: 0.41 (0.17 to 0.67); P = .0034. (D) Change in WBC count and duration of response. Effects of abexinostat without effects of pazopanib on patients’ WBC count on cycle one, day 8 (depicted as ratio of day 1 to day 8) by response duration: > 6 versus < 6 months. Means (± standard error of the mean), 0.84 (± 0.04) versus 1.13 (± 0.06); P = .0029.

