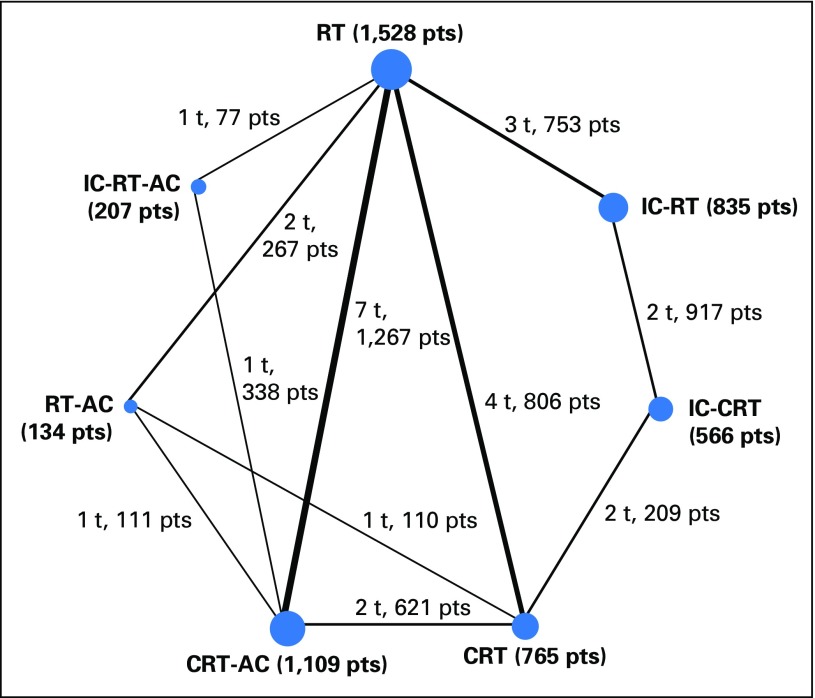
Fig 1.
Graphical representation of the trial network for overall and progression-free survival. The size of the nodes is proportional to the number of patients (pts), which is given in parenthesis in each treatment category. The width of the lines is proportional to the number of comparisons. The number of trials (t) and pts in each comparison are displayed next to each line. The network included 26 comparisons from 20 trials. Six comparisons were counted for the QMH-95 trial (2 × 2 design) and two for the NPC-9902 trial (2 × 2 design; second randomization on radiotherapy [RT] modalities). Because of the duplication of QMH-95 trial arms, some pts are counted multiple times in this figure (in the RT, concomitant chemoradiotherapy [CRT], CRT-adjuvant chemotherapy [AC], and RT-AC groups). However, the statistical analysis takes into account the correlation structure in this design and does not give an excessive weight to duplicated patients. IC, induction chemotherapy.

