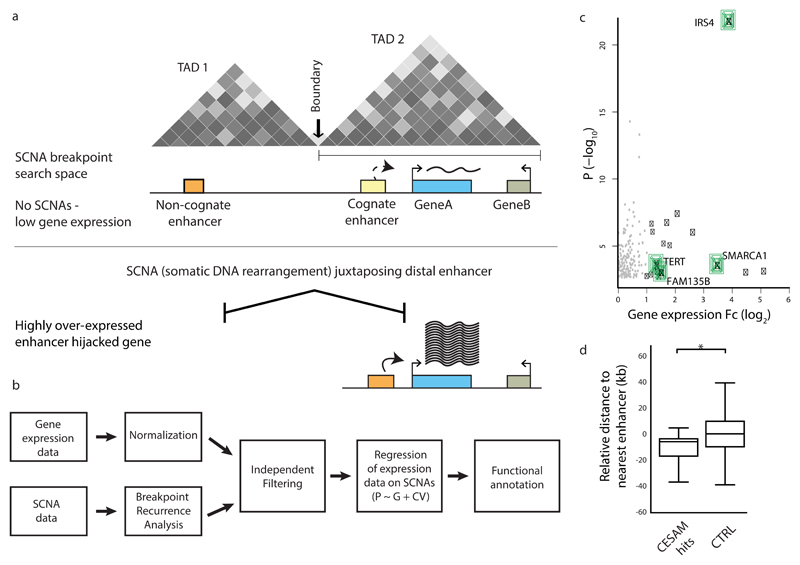
Figure 1. CESAM: framework for uncovering SCNAs driving gene dysregulation in cis.
(a) Principle behind CESAM. TADs are depicted as Hi-C-based contact maps36 with grey shading indicating locus interactions (darker shading indicates stronger interactions as measured by Hi-C). SCNA breakpoints are binned within each TAD (referred to as SCNA breakpoint search space). (b) Detailed analysis workflow of CESAM. (c) Volcano plot of CESAM hits in a pan-cancer setting, with nominal P-values plotted versus expression fold-change (Fc). Candidate genes identified by CESAM are shown as black dots (genes discussed in the text highlighted in green). Grey dots denote loci removed based on CESAM’s filtering criteria (which includes removal of expression alterations driven by gene dosage change). (d) Relative distance to nearest annotated enhancers at distal breakpoints of SCNAs identified by CESAM (‘CESAM hits’) versus SCNAs not implicated by CESAM, which are here used as control (CTRL) (P=0.001; based on 1000 permutations using the standard deviation of the observed proximity). Negative values refer to closer proximity to genomic feature relative to background.

