Fig. 1.
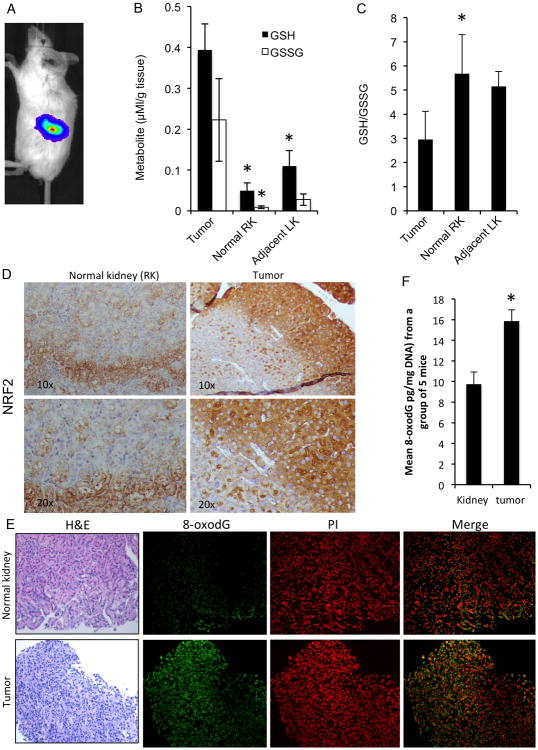
RCC tumors show higher oxidative stress as compared to adjacent normal and contralateral renal tissues.
A. SN12-PM6-1 (SN12) cells were implanted under the renal capsule of the left kidney in SCID mice and whole body bioluminescence imaging was acquired in the three animal experiments as described in Materials and Methods. A representative imaged mouse is shown.
B. The metabolites GSH and GSSG were measured in RCC tumors, tumor-adjacent normal tissue in left kidney (LK), and untouched right kidney (RK) in untreated mice (n=3). Data are mean ± SEM. *p<0.05 compared to tumor tissue. For GSH, p=0.008 for tumor vs RK and p=0.032 for tumor vs LK. For GSSG p=0.006 for tumor vs RK and p=0.071 for tumor vs LK). Results shown are representative of at least three independent experiments
C. The ratio of GSH/GSSG from the same measurements in Fig.1B were calculated in RCC tumors, adjacent renal tissue in left kidney (LK) and tissue from right kidney (RK) (n=3/group). Error bars are SEM. *p<0.05 compared to tumor tissue. For tumor vs RK p=.023, tumor vs LK p=.069. Results shown are representative of at least two independent experiments
D. Representative sections of normal right kidney and tumor tissues were subjected to immunoperoxidase staining for NRF2.
E. Representative sections of normal and tumor kidney tissues were subjected to immunofluorescence staining for 8-oxodG and propidium iodide (PI; nuclear stain).
F. Quantitation of 8-oxodG levels were measured in the DNA of RCC tumors and normal kidney tissues from 5 mice, which were randomly selected from 10 untreated mice, and the average is shown. Data are mean ±SEM. *p<0.05 tumor compared to normal kidney (p=.006).

