Fig. 4.
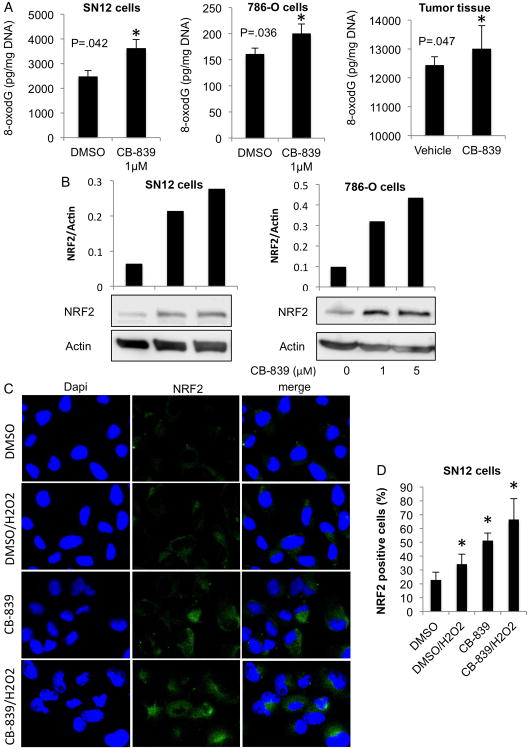
Glutaminase inhibition augments oxidative stress in SN12 and 786-O cells and tumor tissue.
A. SN12 and 786-O cells were grown, incubated with 1 μM CB-839 or DMSO for 24 h, and 8-oxodG levels were measured (left panels). Data are mean ±SD. *p<0.05 compared to control (DMSO). Tumor tissues from the second animal experiment (orally dosed with vehicle or CB-839) were harvested and 8-oxodG levels were quantified (right panel). Data are mean ±SEM. *p<0.05 vehicle treated group as compared to CB-839 treated group (n=4).
B. SN12 and 786-O cells were grown and incubated with CB-839 or DMSO at the concentrations indicated for 24 h. NRF2 levels in whole cell lysates were measured by immunoblotting. Densitometry relative to loading controls is shown.
C. SN12 cells were grown and treated with CB-839 or DMSO at the concentrations and time indicated, followed by H2O2 treatment (where indicated) for 4 h. The cells were fixed and subjected to immunofluorescence staining with NRF2 (green) and DAPI (blue), then visualized with confocal laser-scanning microscopy. The results shown are representative of at least two independent experiments.
D. For each treatment in C group, five randomly selected microscopic fields (40×) of NRF2 positively stained cells were counted. Data are mean ±SD. *p<0.05 compared to DMSO control.

