Fig. 6.
18F-FGln cell uptake and 4-[18F]fluoroglutamine-PET imaging
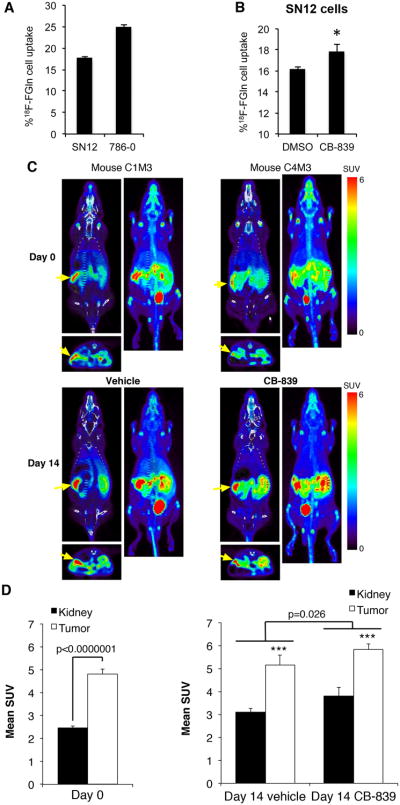
A. Intracellular uptake of an 4-[18F]fluoroglutamine tracer after 30 min incubation in SN12 and 786-O RCC cell lines. (n=3 for each cell line). The Y-axis represents % uptake of total radioactivity by the cells. Data are mean ± SD.
B. 4-[18F]fluoroglutamine uptake in SN12 cells after 4 h incubation with 1 μM CB-839 (n=3) or DMSO (n=3) and 30 min with the 4-[18F]fluoroglutamine. The Y-axis represents % of total radioactivity contained in each group of cells. Data are mean ± SD *p<0.05 compared to DMSO control.
C. Representative mouse images from each treatment group are presented. Coronal and axial sections from PET (color) are overlaid on CT images (grayscale). Adjacent to each coronal PET/CT image is the coronal whole body maximum intensity projection generated from the PET. Yellow arrows point to tumors.
D. Comparison of 18F-FGln uptake in the tumors compared to the right normal kidneys at day 0 (n=10) and day 14 of treatment (n=5/group). Two regions of interest (ROIs; 19.06 mm3 ellipsoids) were drawn on the PET images of each mouse, one on the tumor and one on the right kidney (kidney). Mean standardized uptake value (SUV) of 18F-FGln for each ROI was calculated using AMIDE software. Data are mean ± SEM. ***p=0.002 for tumor compared to right kidney.

